QRLynx Blog
QR Code Guides, Tips & Best Practices


Business Card Statistics: The 88% Myth, Traced to Source
Where '88% of business cards are thrown away within a week' really comes from: a dated trail ending at no study, plus real contact-QR production data.
What Is the Average QR Code Scan Rate? Real 2026 Data
The median QR code gets 2 scans and the mean is 44. Published scan rates disagree because they measure three different things. Real data, terms defined.
QR Code Statistics 2026: First-Party Production Data
QR code statistics for 2026: first-party production data plus independently verified industry figures, with a source and a date on every row.
How Long Do QR Codes Stay Active? QRLynx Survival Data
QRLynx data: 50% of scanned dynamic QR codes still active at 7 days, 30% at 30 days, and 13% at 90 days, across 460,000+ observed code-days.
QR Code Campaign Measurement: Scans to Conversions
Measure QR campaigns across redirect scans, UTM-tagged sessions, conversions, cost, and benchmarks. Includes QRLynx plan data and unique-scan logic.
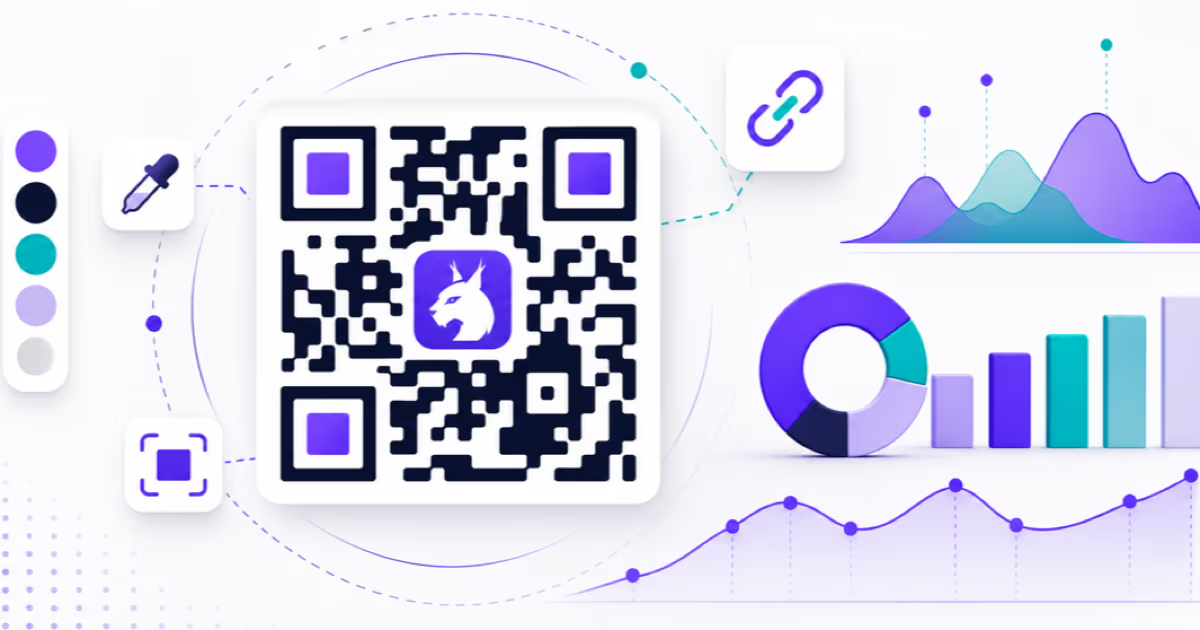
QR Code Creator Statistics 2026: 510 QRLynx Creators
Original QRLynx production study of 510+ creators and 1,111 recorded codes: creation volume, dynamic use, edits, design choices, logo association, and timing.
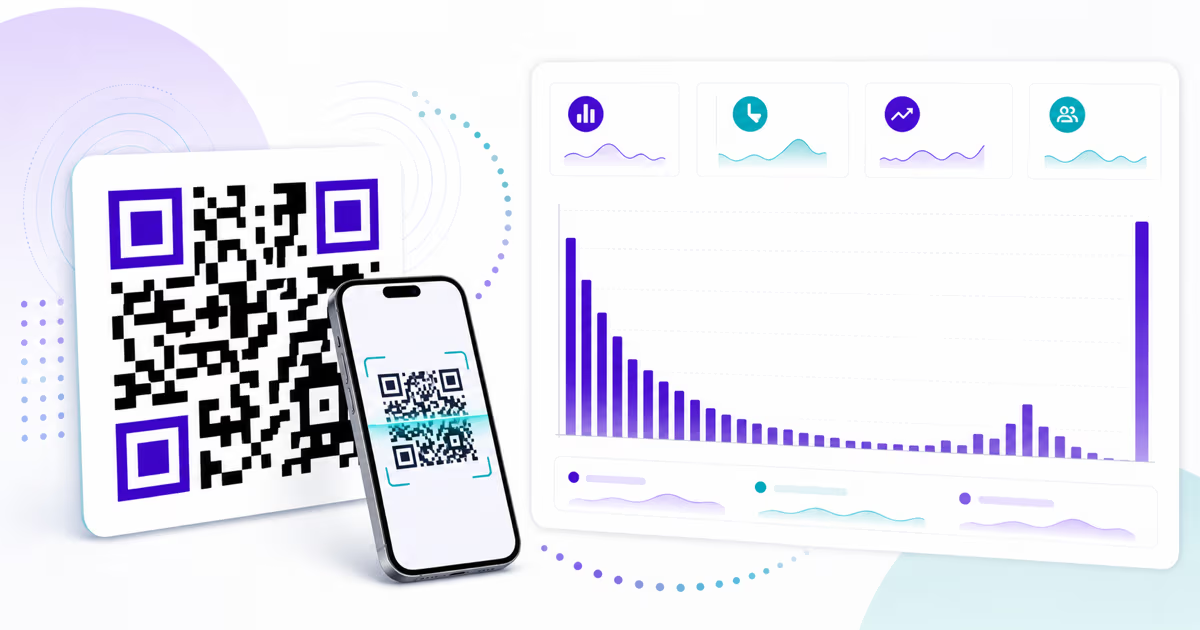
QR Code Scan Benchmarks 2026: QRLynx Data from 1,111 Codes
QRLynx scan benchmarks from 1,111 dynamic QR codes: median 2 scans, top 1% 649+, 34% zero-scan share, and corrected first-scan timing.
QR Code Security Report 2026: What QRLynx Flagged in 754 URLs
QRLynx screening data from 754 URL-type QR submissions: 12.7% required review, why a flag is not a malware verdict, and how to protect each QR campaign.