Track QR Code Scans: Location, Device & UTM Data (2026)
Key Takeaway
Track QR code scans with real-time analytics: location, device, time, and UTM parameters. Step-by-step setup guide for dynamic QR codes and Google Analytics.
Printing a QR code without tracking, whether it links to a website, a PDF, or a WhatsApp conversation, is like running an ad campaign with no reporting: you're spending effort but have zero visibility into results. QR code tracking lets you see exactly how many people scan your code, when they scan it, where they are in the world, and what device they use. This data turns a passive print asset into a measurable marketing channel. With global QR code interactions surpassing 26 million scans per day in 2025 (Statista), tracking is no longer optional. It is a competitive necessity.
The difference between a trackable and non-trackable QR code comes down to one thing: dynamic vs static. A dynamic QR code routes scans through a redirect server that logs every interaction before forwarding users to your destination URL. A static QR code embeds the URL directly, so once printed there's no server in the middle, so there's nothing to track.
This guide walks you through setting up QR code tracking from scratch using QRLynx, reading your analytics dashboard, combining QR data with Google Analytics via UTM parameters, understanding AI Insights for QR analytics, and avoiding the most common tracking mistakes. Whether you're tracking a single business card or managing 500 codes across a national campaign, you'll know exactly how to measure what matters.
Raw tracking tells you what happened. AI Insights helps explain what it may mean. Instead of only seeing a spike in scans, you can quickly understand whether momentum came from a placement, time window, device segment, or regional change worth acting on.
New to QR codes? Start with our complete guide to creating a QR code first.
How QR Code Tracking Works (The Technical Flow)
Understanding the mechanics behind QR code tracking helps you make better decisions about what to track and how to interpret the data. Here's exactly what happens when someone scans a trackable QR code:
- The scan. A user points their phone camera at your QR code. The camera decodes the pattern and reads the embedded URL. For a dynamic QR code that is a short redirect URL on a QRLynx redirect domain, not your final destination.
- The redirect server. The phone opens that short URL, sending an HTTP request to QRLynx's redirect server. In that split second, the server captures: the user's IP address (for geolocation), User-Agent string (for device and browser detection), timestamp, and referrer header.
- Data logging. The server writes this scan event to an analytics database. QRLynx uses Cloudflare Analytics Engine for real-time aggregation, plus a persistent database for historical data. This happens asynchronously, so it doesn't slow down the redirect.
- The redirect. Within milliseconds, the server responds with a 302 redirect to your actual destination URL. The user lands on your website, landing page, PDF, or app store listing without noticing any delay.
The entire process is fast enough to be imperceptible to the user. The user never sees the tracking layer. They scan and arrive at your content. But you now have a complete record of that interaction.
What Data Gets Captured Per Scan
Captured on every scan of a dynamic code. What you can see is tiered: counts and timing on every plan, country on Pro, city, device, browser and OS on Business.
| Data Point | How It's Captured | What It Tells You |
|---|---|---|
| Timestamp | Server clock at request time | When people scan: peak hours, days, seasonal patterns |
| Country & City | IP geolocation (Cloudflare network) | Where your audience is, so you can target top-performing regions |
| Device Type | User-Agent string parsing | iOS vs Android split, so you can optimize landing pages accordingly |
| Browser | User-Agent string parsing | Safari, Chrome, Samsung Internet: test these browsers |
| Operating System | User-Agent string parsing | iOS 17, Android 14, and so on: compatibility insights |
| Unique vs Repeat | IP + User-Agent fingerprint | Are you reaching new people or seeing repeat engagement? |
Important: QR code tracking does not identify individual users by name, email, or phone number. It's anonymous aggregate data, similar to what Google Analytics collects from website visitors. No personal data is stored, and no tracking app needs to be installed on the scanner's phone.
Static vs Dynamic QR Codes: Why It Matters for Tracking
This is the single most important concept in QR code tracking. If you get this wrong, you'll print codes you can't track, and you'll have to start over.
| Feature | Static QR Code | Dynamic QR Code |
|---|---|---|
| Scan tracking | No (data goes directly to destination) | Yes (every scan is logged) |
| Edit destination after printing | No (URL is permanently embedded) | Yes (change anytime from dashboard) |
| Location data | No | Country, city, region |
| Device data | No | OS, browser, device type |
| Scan timeline | No | Scans over time chart |
| Export data | No | CSV export |
| Cost | Free forever | Free (5 on Starter), more on paid plans |
| Use case | Personal use, WiFi codes, one-time links | Marketing, campaigns, business use |
Bottom line: If you need to track scans, you need a dynamic QR code. Static codes have no tracking capability because there's no redirect server in the middle. The destination URL is encoded directly in the QR pattern.
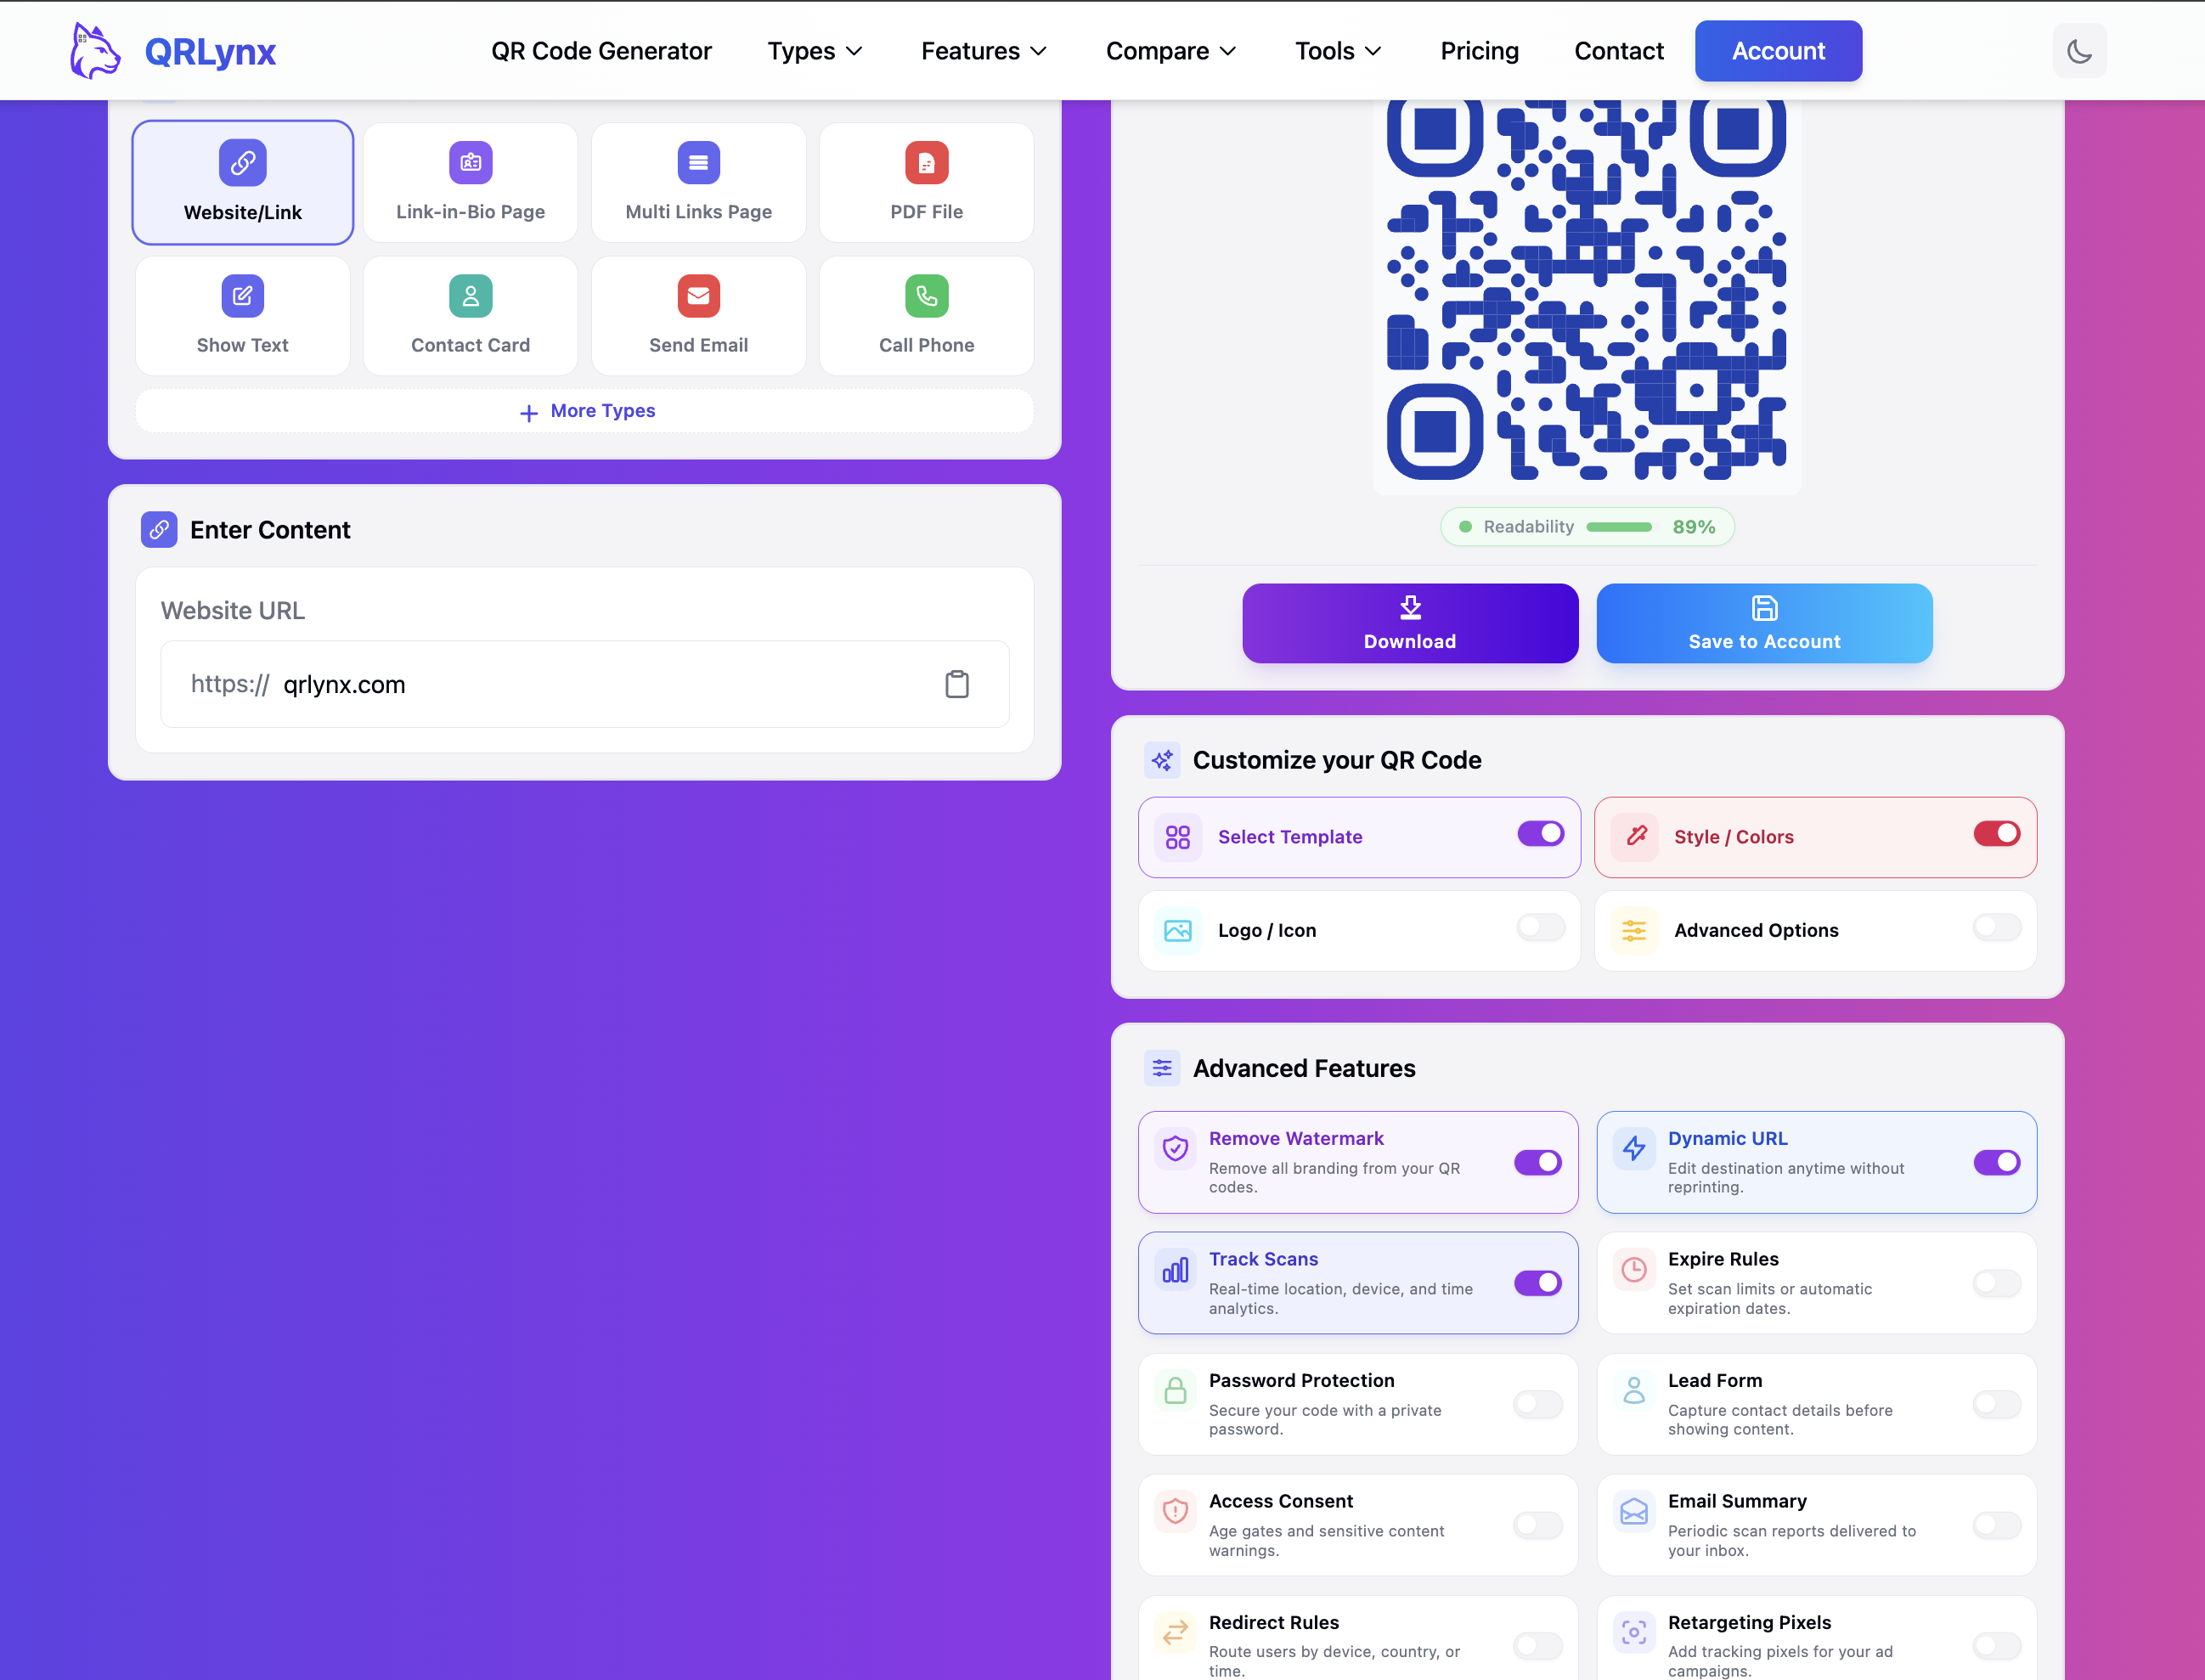
On QRLynx, creating a dynamic QR code is as simple as toggling on the Dynamic URL switch in the Advanced Features section. The free Starter plan includes 5 active dynamic QR codes with unlimited scans, enough to test tracking on a single campaign before upgrading.
How to Set Up QR Code Tracking (Step-by-Step)
Create a trackable dynamic QR code and start collecting scan analytics in under 2 minutes.
Create a Dynamic QR Code with Tracking Enabled
Go to QRLynx.com and click QR Code Generator. Enter your destination URL in the content field. In the Advanced Features section, toggle on Dynamic URL (this enables editable destinations) and Track Scans (this enables scan analytics: counts and timing on every plan, country on Pro, city and device on Business). Both toggles must be on for full tracking. You can also customize the design with your brand colors and add a logo. Click Save to Account to save your trackable QR code.
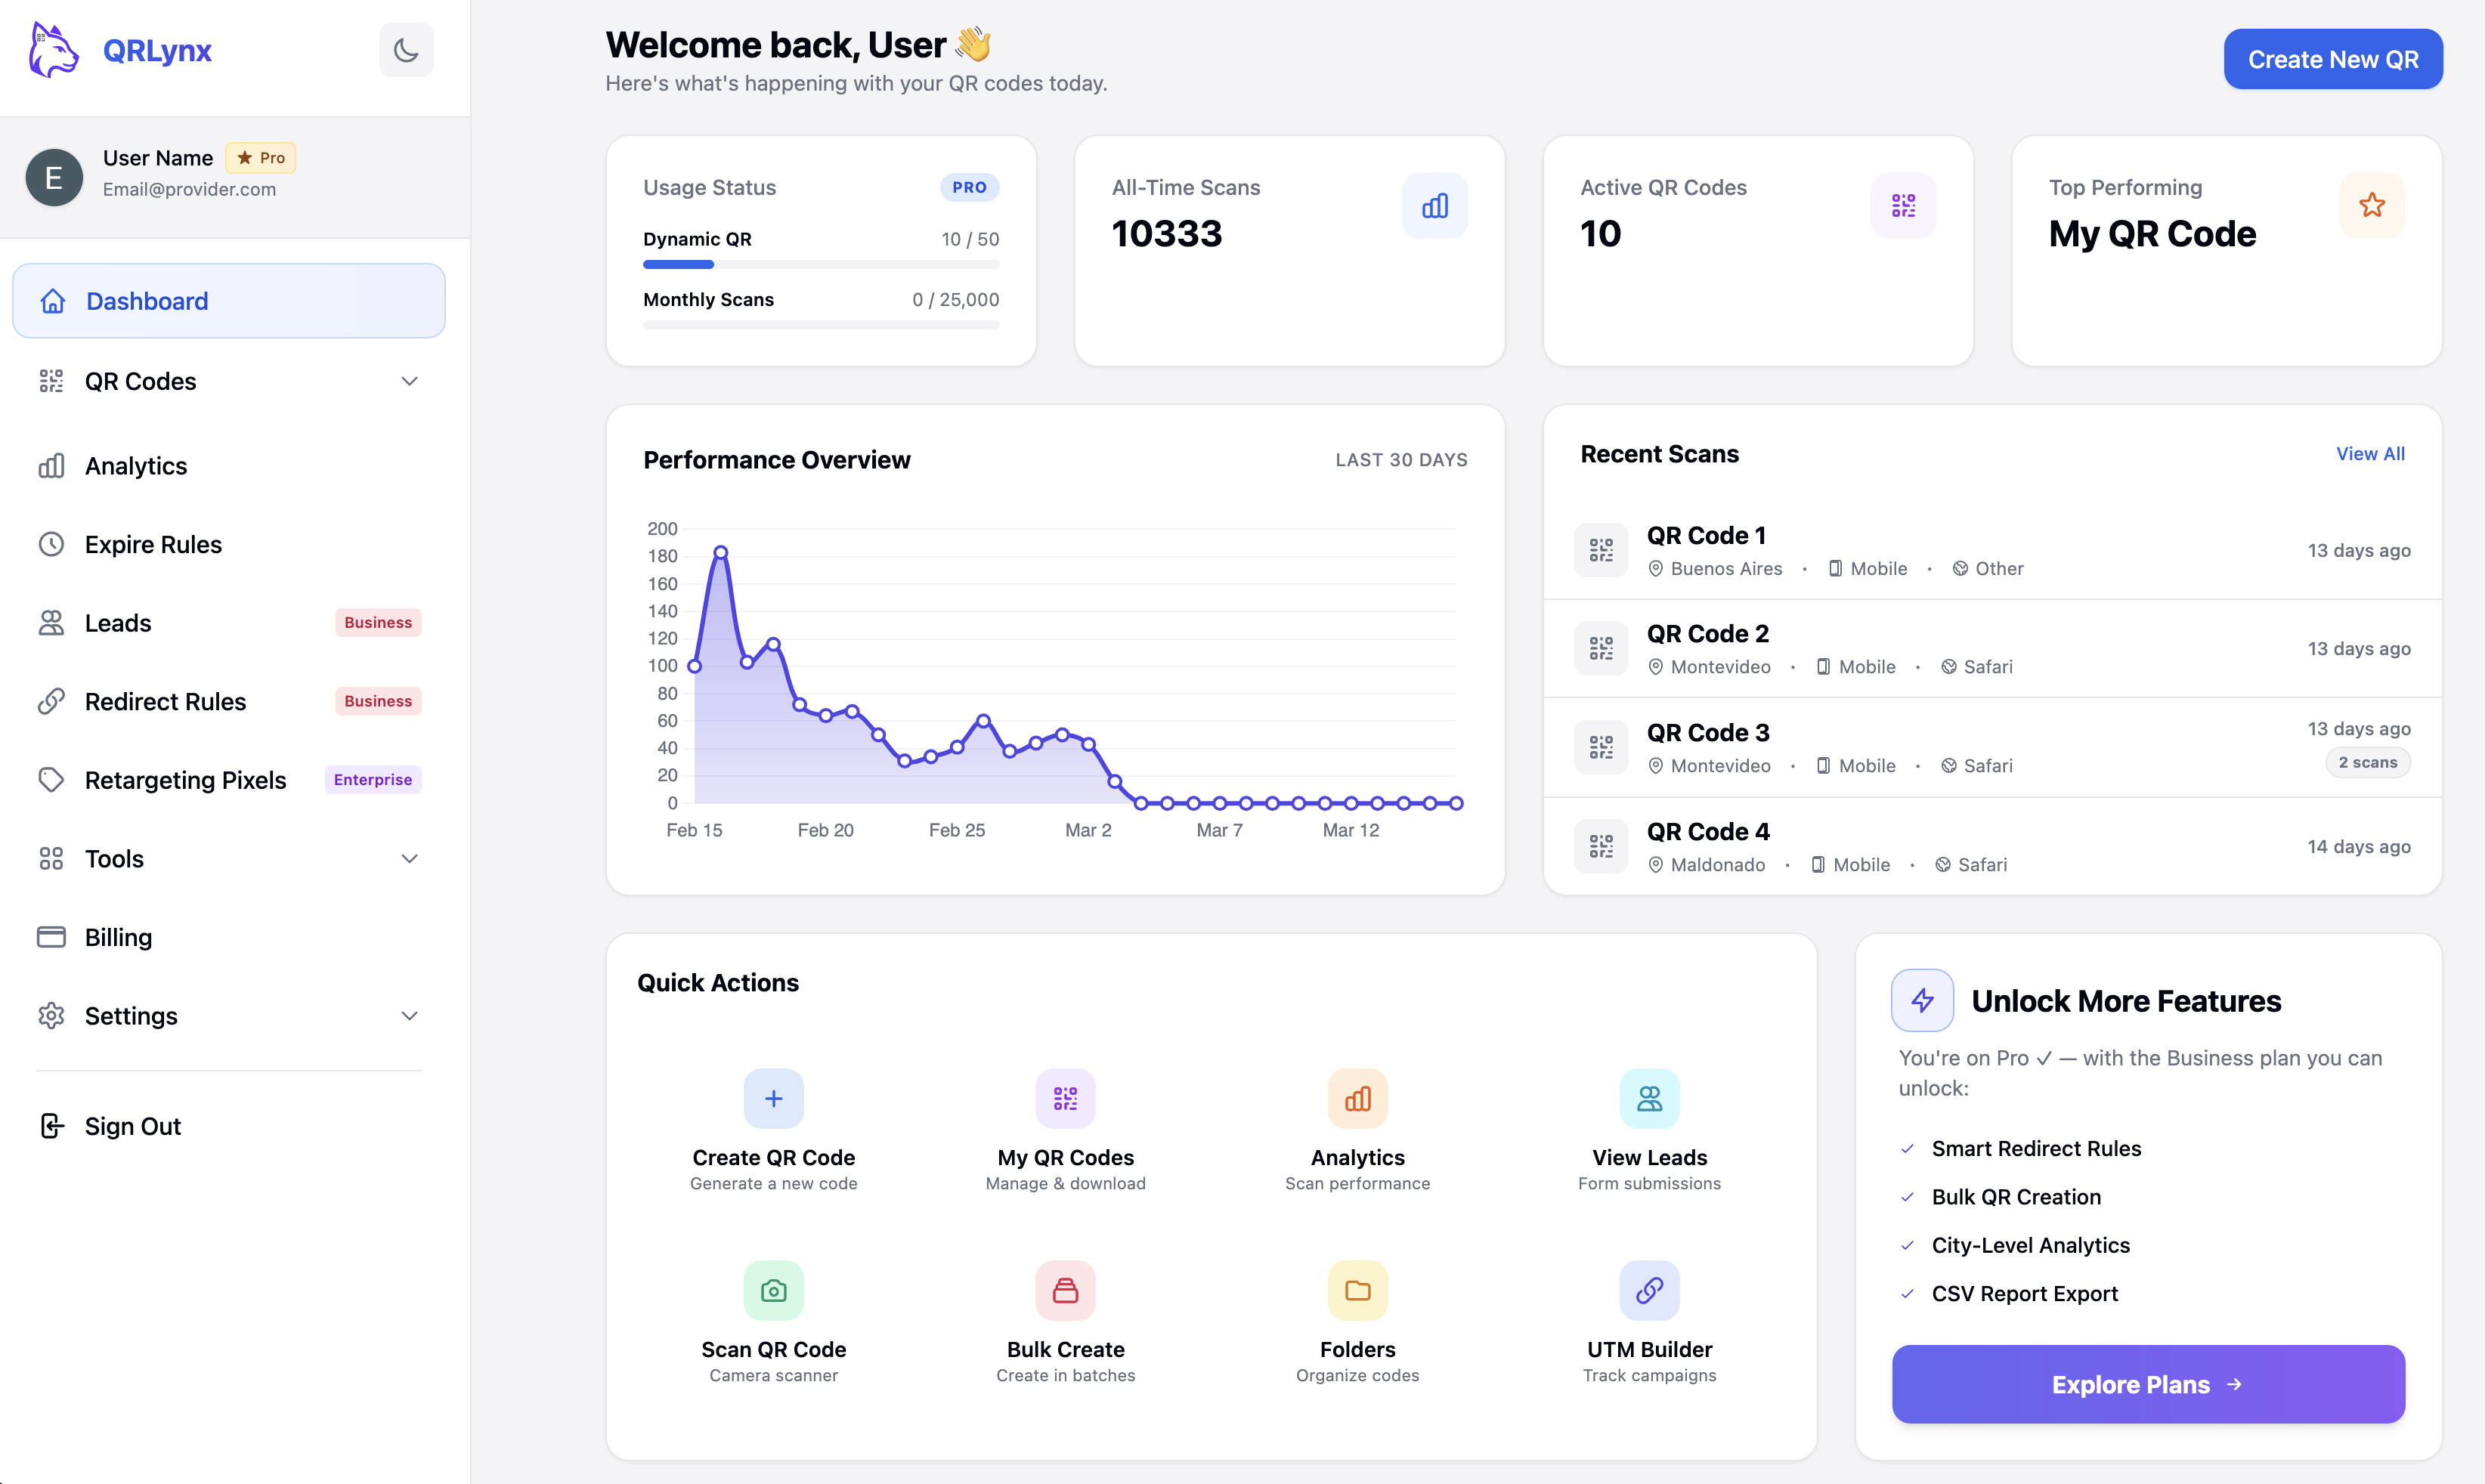
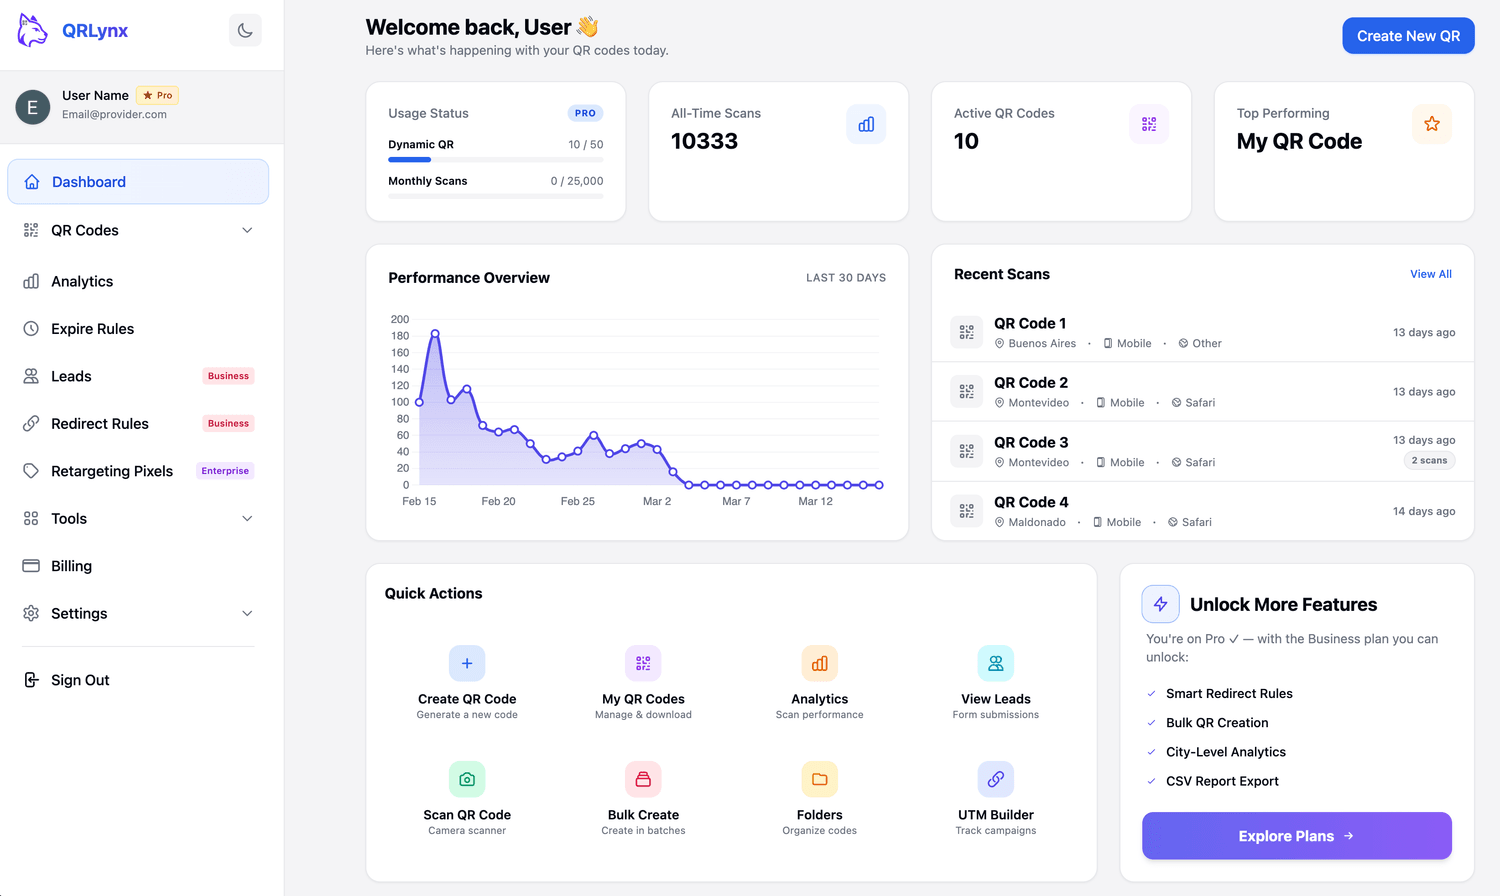
View Your Analytics Dashboard
After your QR code receives scans, go to your QRLynx dashboard. You will see an overview of all your QR codes with key metrics: total all-time scans, active QR codes, and a performance chart showing scan trends over the last 30 days. The Recent Scans section shows your latest QR code activity with device and browser breakdowns. Click on Analytics in the left sidebar to access detailed scan data.
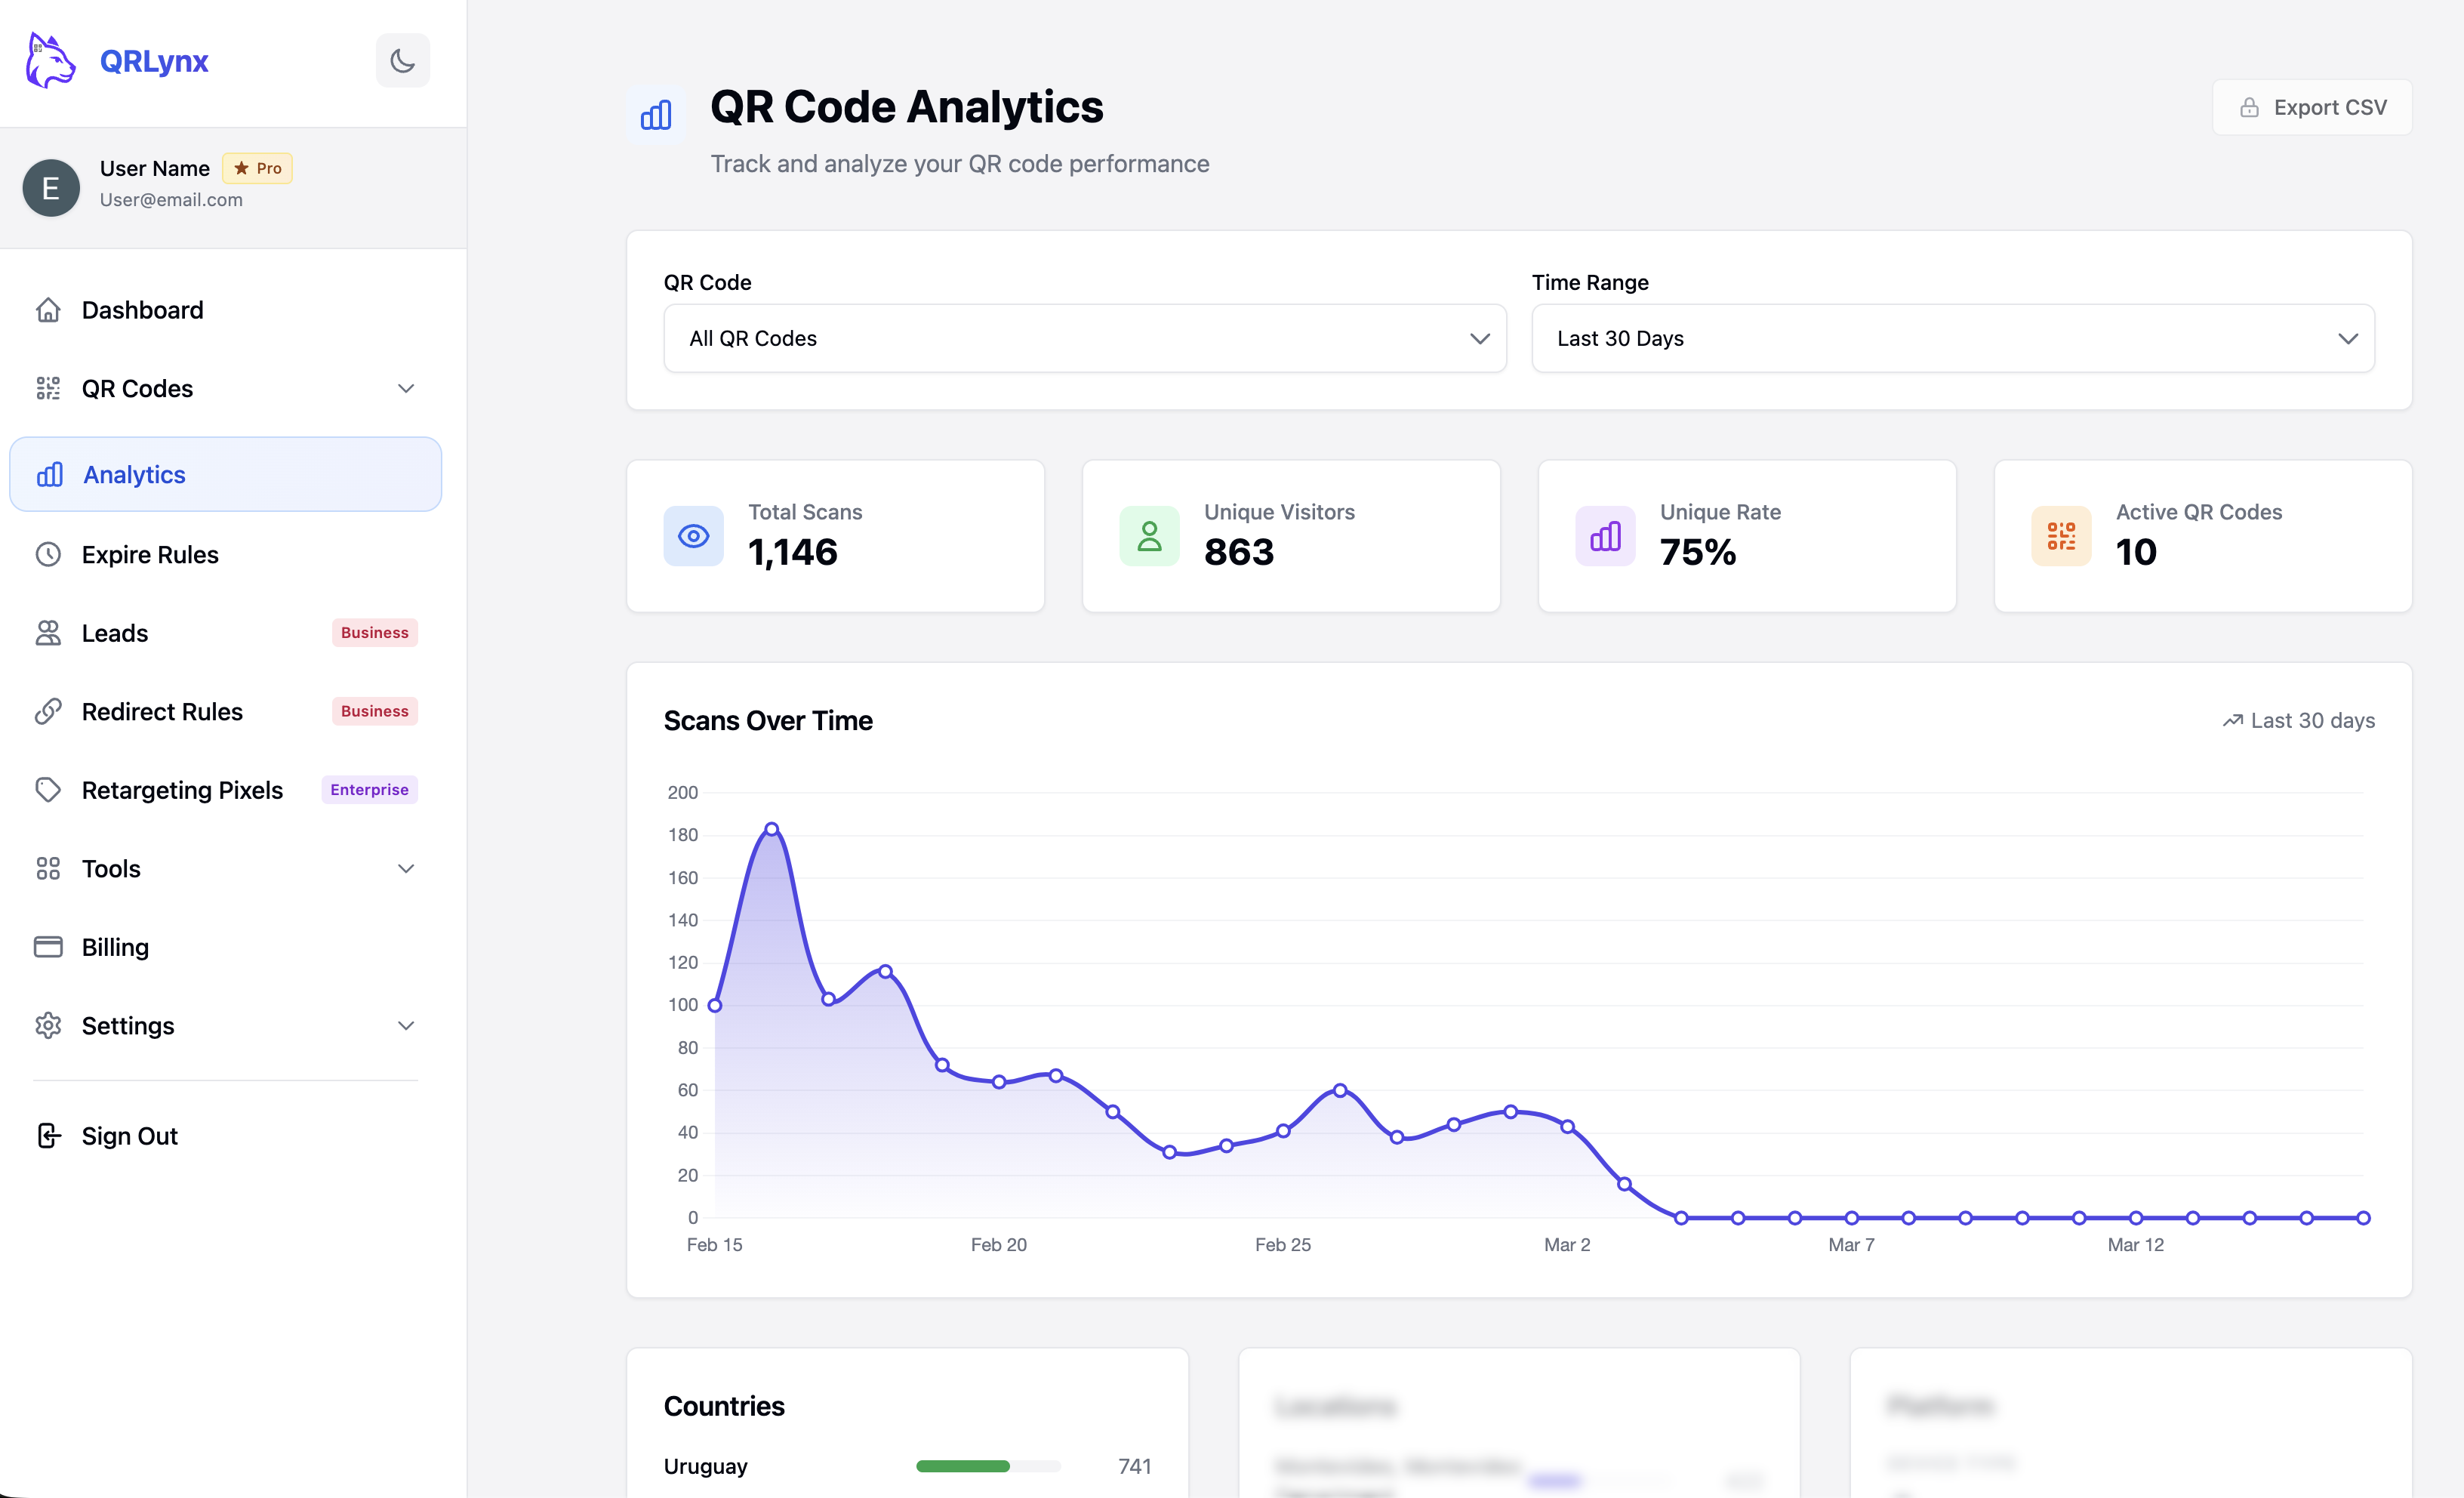
Analyze Detailed Scan Metrics
The Analytics page shows comprehensive scan data for all your QR codes or a single selected code. Key metrics include: Total Scans (all scans in the selected period), Unique Visitors (individual scanners based on IP and device fingerprint), Unique Rate (percentage of first-time scanners), and Active QR Codes. The Scans Over Time chart visualizes daily scan volume. Below the chart, you will find geographic data (Countries breakdown), device types, browsers, and operating systems. Use the Time Range filter to view data for the last 24 hours, 7, 30, 60, or 90 days. Click Export CSV to download raw scan data for use in spreadsheets or BI tools.
Key Metrics You Should Track
Having data is only useful if you know which numbers matter. Here are the metrics that actually drive decisions:
Total Scans vs Unique Visitors
Total scans counts every scan event, including repeat scans from the same person. Unique visitors counts distinct individuals based on IP address and device fingerprint. The ratio between them, your unique rate, tells a critical story:
- High unique rate (70-90%): Your code is reaching new people consistently. This is typical for codes on flyers (see our flyer QR code guide), billboards, packaging (see our product packaging guide), and business cards, which are one-time exposure channels.
- Low unique rate (20-40%): The same people are scanning repeatedly. This is common for codes in restaurants (menus), offices (meeting room links), or retail stores, which are repeat-visit environments. This isn't bad; it means your code is getting habitual use.
- Near 100% unique rate: Almost no repeat scans. Either your content isn't compelling enough for return visits, or the code is in a high-traffic, low-dwell location (transit ads, event banners).
Geographic Distribution
Country and city data shows where your audience is. This is powerful for:
- Multi-location businesses: Compare scan volume between store locations to identify top performers.
- Event marketing: Confirm that scans are coming from the event venue, not just random internet traffic.
- International campaigns: See which markets are responding and adjust language/offers accordingly.
- Fraud detection: If your QR code is on a poster in New York but getting scans from overseas, something may be off.
Device and Platform Data
Knowing the iOS/Android split helps you make better decisions. Juniper Research projects over 2.2 billion smartphones will be used to scan QR codes by 2026 (Juniper Research), making device-level analytics essential:
- Optimize landing pages for the dominant platform (if 80% of scans are iOS, prioritize Safari testing).
- Choose the right app store link if your QR code points to a mobile app.
- Identify accessibility issues: if one platform has significantly fewer scans, your code might not render well on those devices.
Scans Over Time
The timeline chart reveals patterns you'd never see in aggregate numbers:
- Spike on a specific day? Correlate with an event, email campaign, or social post that drove traffic to your physical QR code.
- Steady decline? Your code's placement may be losing visibility, or the campaign has run its course.
- Weekly cycles? If scans peak on weekdays and drop on weekends (or vice versa), you know when your audience is engaging.
- Sudden drop to zero? The code may have been removed, covered, or the physical material was discarded.
Tracking QR Codes with Google Analytics (UTM Parameters)
QRLynx's built-in analytics track the scan itself: when, where, and on what kind of device. They never identify the person scanning. But what happens after the scan? How long do they stay on your page? Do they convert? That's where Google Analytics comes in.
The bridge between QR scan data and website analytics is UTM parameters, tags you add to your destination URL that Google Analytics reads automatically.
How to Add UTM Parameters to Your QR Code
Instead of using a plain URL like https://yoursite.com/landing-page, append UTM tags:
https://yoursite.com/landing-page?utm_source=qr_code&utm_medium=print&utm_campaign=spring_sale_2026&utm_content=store_window_posterUse this tagged URL as the destination in your QRLynx dynamic QR code. Google Analytics will automatically categorize traffic from this QR code under the campaign you specified.
UTM Parameter Breakdown
| Parameter | Purpose | Example Value |
|---|---|---|
| utm_source | Where the traffic comes from | qr_code |
| utm_medium | Marketing channel type | print, packaging, signage |
| utm_campaign | Campaign or promotion name | spring_sale_2026 |
| utm_content | Differentiates individual placements | store_window, receipt, menu |
QRLynx includes a free UTM Builder tool that generates tagged URLs automatically, with no need to type parameters by hand.
Naming Convention for Multi-Location Campaigns
If you're deploying QR codes across multiple locations, use a consistent naming convention. This is where most campaigns fall apart: inconsistent UTM names make GA4 reports messy and unreadable. For the campaign-level findings (top 1% drives 70% of scans, the 12% revenue-attribution gap, QR-type engagement multipliers) see what 1,000+ campaigns reveal about scan attribution:
utm_source: qr_code
utm_medium: [material_type]  → print, packaging, signage, receipt, business_card
utm_campaign: [campaign_name]_[year_quarter]  → spring_sale_2026_q1
utm_content: [location]_[placement]  → nyc_store_window, la_register_counter
This structure lets you filter GA4 reports by campaign, then drill down by location and placement to see which physical code placements drive the most traffic and conversions.
Viewing QR Code Traffic in Google Analytics 4
Once scans start flowing, find your QR traffic in GA4:
- Go to Reports → Acquisition → Traffic Acquisition
- Change the primary dimension to Session source/medium
- Search for
qr_codeand you'll see all QR-driven sessions - Click into any row to see utm_campaign and utm_content breakdowns
This gives you the full picture: QRLynx tells you who scanned and when, and GA4 tells you what they did on your site after scanning.
Advanced Tracking Strategies
A/B Testing with Multiple QR Codes
Want to know which flyer design, color scheme, or call-to-action drives more scans? Create multiple dynamic QR codes pointing to the same URL but with different utm_content values:
- Version A (red flyer):
utm_content=flyer_red_v1 - Version B (blue flyer):
utm_content=flyer_blue_v1
Place them in the same environment (e.g., alternating between store locations) and compare scan rates after 2-4 weeks. The QR code with more scans indicates the more effective design. In GA4, compare conversion rates between the two content tags to see which drives more post-scan engagement.
Tracking Offline-to-Online Conversions
QR codes are one of the few reliable bridges between offline marketing and online measurement. Here's a framework for calculating actual ROI:
- Assign a value to each conversion. If 10% of QR scanners make a purchase and your average order is $50, each scan is worth $5 on average.
- Track scans per placement. A poster in your store window might get 200 scans/month while a receipt QR code gets 50.
- Calculate cost per scan. If printing 1,000 flyers costs $200 and generates 300 scans, your cost per scan is $0.67.
- Compare to other channels. If Google Ads costs $2.50 per click and your QR code costs $0.67 per scan, QR is 3.7x more cost-effective for that audience.
Scan Scheduling with Expire Rules
For time-sensitive campaigns, use QRLynx Expire Rules to automatically deactivate a QR code after a specific date or scan count. This is useful for:
- Limited-time promotions ("20% off, valid through March 31")
- Event-specific codes that shouldn't work after the event ends
- Free sample campaigns with a maximum redemption count
Expired scans redirect to a custom page of your choice, so you can show a "This offer has ended" message instead of a broken link.
Smart Redirect Rules for Multi-Platform Tracking
Use Smart Redirect Rules to send scanners to different destinations based on their device or location, while tracking everything from one QR code:
- iOS users → Apple App Store page
- Android users → Google Play Store page
- Desktop users → Web app signup page
All scans are tracked under the same QR code's analytics, but each audience segment sees the most relevant destination.
Common QR Code Tracking Mistakes
After working with thousands of QR code campaigns, these are the errors we see most often:
1. Using a Static QR Code and Expecting Analytics
This is the number one mistake. If you created a QR code by just pasting a URL into any free generator without enabling dynamic/tracking features, your code is static. It embeds the URL directly in the QR pattern, so there is no redirect and no tracking. You must create a dynamic QR code for tracking to work.
2. Inconsistent UTM Parameters
Using utm_source=QRCode on one code and utm_source=qr-code on another splits your data into separate entries in Google Analytics. UTM parameters are case-sensitive. Pick a convention and stick to it: qr_code (lowercase, underscore) is our recommendation.
3. Not Testing Before Mass Printing
Always scan your QR code from at least 2 devices (one iPhone, one Android) before printing hundreds of copies. Check that:
- The redirect works and lands on the correct page
- The tracking dashboard shows the test scan
- UTM parameters appear correctly in Google Analytics real-time reports
4. Placing Codes Where They Can't Be Scanned
A QR code on a highway billboard is nearly useless, because drivers can't scan while moving. A code behind a glass display case gets glare that confuses cameras. A tiny code on a dense poster won't scan from more than a few inches. Think about the scanning context before printing.
5. Ignoring the Data
Many people set up tracking and never check their dashboard. Set a calendar reminder to review your QR analytics weekly or monthly. The data is only valuable if you act on it: move codes to higher-traffic locations, update underperforming destinations, or shut down campaigns that aren't working.
6. No Fallback for Broken Links
If your destination URL changes or goes down, every scan leads to a 404 error. With dynamic QR codes, you can update the URL instantly from your dashboard. But you need to monitor for this. QRLynx's analytics dashboard helps you spot sudden drops in engagement that might indicate a broken link.
Tracking Limitations: What QR Codes Can't Tell You
Honest QR tracking guides are rare, because most platforms oversell their analytics capabilities. Here are the real limitations you should understand:
VPNs and IP Masking
If a scanner is using a VPN, their IP address will show the VPN server's location, not their real location. In 2026, roughly 30% of mobile users worldwide use VPNs, according to Pew Research and industry surveys. This means your geographic data is directionally accurate but never 100% precise. City-level data is especially affected. Country-level data is more reliable.
Apple Private Relay (iCloud+)
Apple's Private Relay feature, available to all iCloud+ subscribers, routes Safari traffic through two separate relays to mask the user's IP address. This affects QR scans opened in Safari: the geolocation data will show a general region rather than a specific city. As of 2026, this affects a significant portion of iPhone users.
Unique Visitor Accuracy
"Unique visitors" in QR analytics is based on IP address + User-Agent fingerprinting, not cookies or login sessions. This means:
- Two people scanning from the same WiFi network may count as one unique visitor
- The same person scanning on WiFi then cellular may count as two unique visitors
- This is an estimate, not a precise count, so treat it as directionally accurate (±10-15%)
No Individual Identification
QR code tracking, like most anonymous web analytics (Statista), cannot tell you who scanned. It reports only anonymous attributes like location and device. There is no way to get a scanner's name, email, or phone number from the scan itself. If you need to capture contact details, pair your QR code with a landing page that has a form or use QRLynx's Lead Form feature to capture consent-based contact info before revealing the content.
Bot and Crawler Traffic
Search engine bots, security scanners, and link preview generators (like Slack, iMessage, and WhatsApp) can trigger scan events when they encounter your QR code's redirect URL online. QRLynx filters out known bot User-Agents, but some traffic may still be non-human. If you see unusual scan spikes with no corresponding human behavior, bot traffic is the likely cause.
Managing Tracking for Large Campaigns
Tracking a single QR code is straightforward. Managing analytics across 50, 100, or 500+ codes requires a system. Here's how experienced teams handle it:
Organize with Folders
Group QR codes by campaign, location, or purpose. QRLynx supports folders on Starter+ plans and above:
- By campaign: "Spring Sale 2026", "Product Launch Q2", "Trade Show SXSW"
- By location: "NYC Stores", "LA Stores", "Chicago Stores"
- By material type: "Flyers", "Packaging", "Business Cards", "Signage"
Naming Convention for QR Codes
Adopt a consistent naming scheme that makes codes findable months later:
[Campaign]_[Location]_[Placement]_[Date]

Examples:
spring-sale_nyc-soho_window-poster_2026-03
product-launch_online_email-footer_2026-04
trade-show_sxsw_booth-banner_2026-03
Bulk QR Code Creation
For campaigns with dozens of codes, QRLynx's Bulk QR Code feature (Business plan and above) lets you upload a CSV with all your URLs and generate tracked codes in one batch. Each code gets its own analytics, but you can view aggregate data across the entire campaign.
Export and Reporting
Click Export CSV from the Analytics page to download raw scan data. Use this for:
- Custom reports in Google Sheets, Excel, or Looker
- Combining QR scan data with other marketing channels in your BI tool
- Monthly executive reports showing QR campaign ROI
- Historical analysis: compare this quarter's scans to last quarter
QRLynx includes 3 months of detailed scan analytics on every plan, with longer summaries by tier: 1 year on Starter+, 2 years on Pro, 3 years on Business, and all-time on Enterprise. Business and Enterprise add CSV export for reporting workflows when you need spreadsheet or BI analysis.
Industry Use Cases for QR Code Tracking
QR tracking isn't just for marketers. Here's how different industries use scan analytics to make decisions:
Retail & E-commerce
Track which in-store displays, product tags, and receipt codes drive the most online traffic. A clothing retailer might discover that QR codes on fitting room mirrors get 5x more scans than codes on price tags, because customers scan while they're considering a purchase, not while browsing the rack.
Restaurants & Hospitality
See also: How to Create a Google Review QR Code for a complete guide to collecting customer reviews.
Monitor menu QR code usage across table numbers to optimize server coverage. Track which promotional codes ("scan for dessert menu", "scan for today's special") get the most engagement. Identify peak scan hours to ensure your digital menu loads fast during lunch and dinner rushes.
Real Estate
Put QR codes on property signs, brochures, and listing flyers. Track which properties generate the most scan interest, which neighborhoods have the most engaged buyers, and which marketing materials (yard sign vs newspaper ad vs mailer) drive the most scans. This same approach works for YouTube video QR codes where tracking which placements drive the most views is critical.
Healthcare
Track patient engagement with informational QR codes in waiting rooms. Monitor which educational materials get scanned most often. Use analytics to justify investments in patient communication tools.
Events & Conferences
Place unique QR codes at each booth, session, and registration area. Post-event, analyze which sessions drove the most engagement, which sponsors' booths got the most scans, and what time attendees were most active. This data is invaluable for planning next year's event and for sponsor reporting.
Education
Track student engagement with supplementary material QR codes in textbooks, handouts, and classroom posters. See which resources get accessed most and at what times (pre-exam cramming is very visible in the data).
Privacy and Compliance
If you're tracking QR code scans, you have a responsibility to handle data ethically. Here's what you need to know:
What QR Tracking Collects (and What It Doesn't)
QR code tracking collects anonymous, aggregate data: IP addresses (for geolocation), device types, browsers, and timestamps. It does not collect names, emails, phone numbers, browsing history, or any personally identifiable information (PII) unless you explicitly pair the QR code with a form that asks for it.
GDPR Compliance
Under GDPR, IP addresses are considered personal data. If your QR codes target EU audiences, ensure your privacy policy mentions QR code tracking, and consider using a tracking platform (like QRLynx) that processes data on infrastructure with GDPR-compliant data handling. QRLynx processes scan data on Cloudflare's global network with no long-term IP address storage.
Best Practices
- Mention QR tracking in your privacy policy, a one-line addition like "We use QR code analytics to track scan counts, geographic regions, and device types" is sufficient for most use cases.
- Don't try to identify individuals from scan data. IP-based identification is both unreliable and ethically questionable.
- Set data retention policies. Don't keep scan data indefinitely. QRLynx automatically enforces retention limits based on your plan tier.
- Use consent forms when collecting personal data. If your QR code leads to a form that captures names or emails, that's a separate data collection event that requires explicit consent, so use QRLynx's Access Consent feature for this.
QR Code Tracking FAQ
Answers to the most common questions about tracking and analyzing QR code scans.
Can QR codes track how many times they are scanned?
Yes, but only dynamic QR codes. A dynamic QR code routes scans through a redirect server that logs every scan event with timestamp, location, and device data. Static QR codes embed the URL directly in the pattern, so there is no server in the middle to count scans. To track scans, you must create a dynamic QR code with tracking enabled.
Can QR codes track my location?
QR codes can determine your approximate geographic location (country and city) based on your IP address at the time of scanning. This is the same technique every website uses. They cannot access your GPS, home address, or precise coordinates. If you use a VPN or Apple Private Relay, only a general region will be visible, not your actual city.
Are QR code scans anonymous?
Yes. QR code tracking collects anonymous data: device type, approximate location, browser, and timestamp. It does not identify you by name, email, or phone number. There is no way for a QR code creator to know who specifically scanned their code unless the landing page includes a form where you voluntarily provide personal information.
How do I know if someone scanned my QR code?
If you created a dynamic QR code with tracking enabled, log into your QRLynx dashboard and go to the Analytics section. You will see total scans, unique visitors, scan timeline, geographic breakdown, and device data. You can view analytics for all codes at once or filter to a specific QR code.
Can I track a QR code with Google Analytics?
Yes. Add UTM parameters to your destination URL before creating the QR code, for example ?utm_source=qr_code&utm_medium=print&utm_campaign=spring_sale. Google Analytics 4 will automatically categorize this traffic under your specified campaign. QRLynx also offers a free UTM Builder tool that generates tagged URLs automatically.
What is the difference between total scans and unique visitors?
Total scans counts every scan event including repeat scans from the same person. Unique visitors counts distinct individuals based on IP address and device fingerprint. If one person scans your QR code 5 times, that is 5 total scans but 1 unique visitor. The unique rate (unique visitors divided by total scans) tells you whether you are reaching new people or seeing repeat engagement.
Can I track QR codes after they are already printed?
Only if you originally created a dynamic QR code. Dynamic codes use a short redirect URL that passes through a tracking server, so tracking works regardless of when the code was printed. If you printed a static QR code, there is no way to add tracking retroactively. You would need to create a new dynamic code and reprint.
How accurate is QR code location tracking?
Country-level data is highly accurate (95%+), consistent with industry-standard IP geolocation databases used across the analytics industry (Statista QR Code Report). City-level data is accurate for about 70-80% of scans but can be affected by VPNs, Apple Private Relay (iCloud+), and mobile carrier IP routing. Treat geographic data as directionally correct rather than GPS-precise. It is reliable enough for identifying top-performing regions and markets.
Do I need a paid plan to track QR code scans?
QRLynx offers 5 free dynamic QR codes on the Starter plan with unlimited tracked scans, enough to test tracking on a single campaign. For larger QR portfolios, CSV export, city/device/browser analytics, redirect rules, and expire rules, choose the plan that includes those features.
Can QR code tracking identify individual users?
No. QR code tracking collects anonymous aggregate data: location, device, browser, and timestamps. It cannot identify who specifically scanned the code. If you need to capture personal information like names or email addresses, pair your QR code with a landing page form or use QRLynx Lead Form feature, which requires explicit user consent before collecting data.
What happens if I change the destination URL: do I lose tracking data?
No. With a dynamic QR code, changing the destination URL does not affect your existing analytics. All historical scan data is tied to the QR code itself, not the destination. You can change where the code points as many times as you want. Your scan history, location data, and device metrics remain intact.
How long is QR code scan data retained?
QRLynx includes 3 months of detailed scan analytics on every plan, with longer summaries by tier: 1 year on Starter+, 2 years on Pro, 3 years on Business, and all-time on Enterprise. Business and Enterprise include CSV export for teams that need spreadsheet or BI reporting workflows.
Can I export my QR code scan data?
Yes. QRLynx provides CSV export from the Analytics page on Business plans and above. The export includes timestamp, country, city, device type, browser, operating system, and unique/repeat flag for each scan. You can use this data in Google Sheets, Excel, Looker, Tableau, or any BI tool for custom reporting.
Is QR code tracking GDPR compliant?
QR code tracking that collects only anonymous aggregate data (device type, approximate location, timestamps) generally does not require explicit consent under GDPR. However, IP addresses are considered personal data under GDPR. QRLynx processes data on Cloudflare infrastructure with no long-term IP storage. We recommend mentioning QR analytics in your privacy policy for full compliance.